Understanding Dashboard Insights in VwD
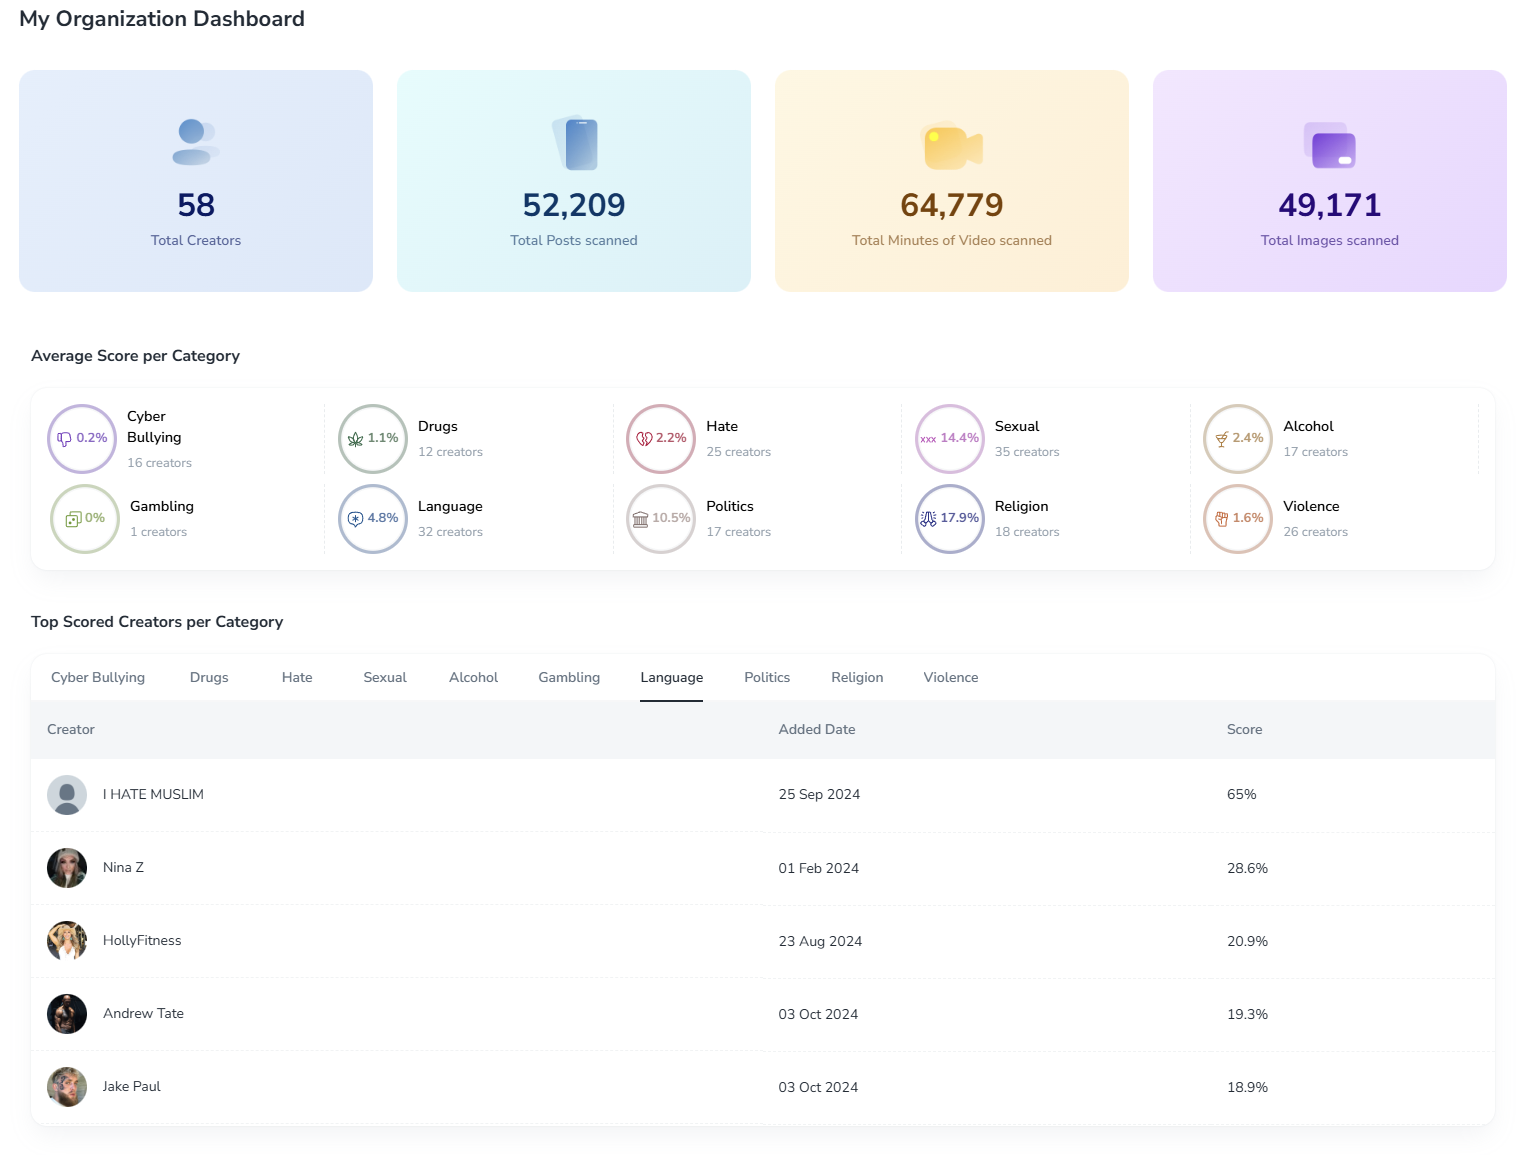
The VwD dashboard serves as the central hub for managing your creator ecosystem, offering a clear and comprehensive overview of your organization's activity. Designed with simplicity and efficiency in mind, the dashboard helps users monitor performance, track risks, and access actionable insights at a glance.
This guide walks you through the key sections of the dashboard, explaining how to interpret the data and use it to optimize your brand safety and compliance efforts.
Why Use the Dashboard?
The VwD dashboard provides:
- At-a-Glance Metrics: Quickly review the state of your creator partnerships and their content.
- Compliance Monitoring: Stay informed about flagged content and potential violations.
- Efficiency: Reduce the time spent navigating multiple sections by accessing key data in one place.
Key Sections of the Dashboard
1. Summary Overview
This section provides a high-level snapshot of your organization’s activity.
Key Metrics:
- Total Creators Added: The number of creators currently managed in your organization.
- Total Content Scanned: The cumulative count of posts, images, videos, and other content analyzed.
- Compliance Violations: The number of flagged violations related to FTC, FINRA, or FDA guidelines.
How to Use:
- Monitor Progress: Ensure all creators in your campaigns have been scanned and reviewed.
- Identify Gaps: Investigate cases where creators have no flagged content or unusually low engagement metrics.

2. Sensitivity Score Averages
The dashboard aggregates average sensitivity scores for all creators in your organization.
Categories Include:
- Hate Speech
- Violence
- Sexual Content
- Drugs
- Politics
- Religion
- Cyberbullying
How to Use:
- Assess Overall Risk: Understand which categories are most frequently triggered.
- Set Priorities: Focus on categories with higher averages to address risks proactively.
3. Top Flagged Creators
This section highlights creators with the most flagged content, enabling you to prioritize your attention where it’s needed most.
Details Provided:
- Creator’s name and platform.
- Number of flagged posts or violations.
- Categories with the highest sensitivity scores.
How to Use:
- Review Flagged Content: Click on a creator’s name to view their flagged content in detail.
- Adjust Campaign Lists: Remove high-risk creators from ongoing campaigns if necessary.
4. Flagged Content Breakdown
Provides a detailed analysis of flagged content by type and category.
Data Displayed:
- Content Types: Posts, images, videos, or audio.
- Platform Distribution: Instagram, TikTok, YouTube, etc.
- Category Trends: E.g., a spike in flagged "Hate Speech" or "Alcohol" content.
How to Use:
- Identify Trends: Look for patterns, such as recurring issues on specific platforms or content types.
- Inform Campaign Decisions: Avoid platforms or content types with consistent risks.
5. Compliance Violations Overview
This section tracks violations across supported regulatory frameworks.
Includes:
- FTC Compliance Issues: Missing disclosures, false claims, or endorsements.
- FINRA and FDA Violations: Relevant to industries such as finance or pharmaceuticals.
How to Use:
- Mitigate Risks: Address compliance violations promptly to avoid regulatory penalties.
- Document Findings: Use this data for reporting and internal audits.
Actions You Can Take from the Dashboard
View Creator Profiles
Click on any creator’s name to access their profile, Sensitivity Scorecard, and flagged content details.
Download Reports
Export a PDF summary of dashboard insights for internal use or stakeholder presentations.
Adjust Sensitivity Thresholds
Navigate to the "Filters" section to refine your criteria for campaign preparation.
Best Practices for Using the Dashboard
Check the Dashboard Regularly
Make it a habit to review the dashboard daily, especially during active campaigns.
Focus on High-Risk Creators
Use the "Top Flagged Creators" section to prioritize intervention where it’s needed most.
Analyze Trends
Review the Flagged Content Breakdown periodically to identify recurring issues and refine your approach.
Use Reports for Stakeholders
Share PDF reports from the dashboard to keep your team or clients informed about compliance and brand safety efforts.
FAQs
Q: Can I customize the dashboard view?
Not currently. Customizable dashboards are planned for future updates.
Q: Are predictive metrics available?
Not yet, but predictive analytics and trends are in development and will be included in a future release.
Q: Does the dashboard support drill-downs into data?
Currently, the dashboard provides high-level insights. Drill-down capabilities are planned for future iterations.
Stay Informed with VwD’s Dashboard Insights
The VwD dashboard is your go-to resource for managing your creator ecosystem effectively. With its intuitive design and actionable data, you can make informed decisions, ensure compliance, and protect your brand’s reputation effortlessly.
Log in to your VwD account today to explore the Dashboard Insights feature. For additional help, contact us at hello@vwd.ai.
